Where the Market Is A Year Since COVID-19 Began
As we approach the one-year mark since the coronavirus pandemic (COVID-19) began, we want to reflect on the year that the market has had. Its been quite a wild ride, especially in the past week or so, with the 10-year treasury yield hitting its highest level in one year, reaching 1.619%, to date. We have also seen a great deal of volatility in technology stocks, as they are currently down relative to the Dow Jones Industrial Average.
As we continue to see volatility a year into the pandemic, we want to stress knowing your timeframes, understanding volatility along with time in the market versus timing the market.
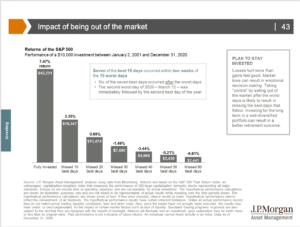
Below we have attached a chart from JP Morgan illustrating the difference in return if you were to miss the best days in the market. This chart will help you see the true understanding of sticking to your long term plan. Check out the video below for Brad’s take on the market in detail, including tax implications, timing the market, and more. Let us know what you think and reach out to us with any questions at info@shermanwealth.com.